

One of the main problems community managers face when they want to measure project’s health, is related with the life-cycle of it. If community managers are able to identify whether the project is either in growth, maturity or decline, that can be used when making further decisions regarding the project and its developer community
Last February 1st was CHAOSSCon, where Bitergia presented the new GrimoireLab panels aligned with the CHAOSS growth-maturity-decline metrics, with the aim to put these metrics into action and be able to visualize them for a better goal-question-metric strategy implementation.
According to CHAOSS, one of the main pillars to measure growth maturity and decline is related with code development such as lines of code changed, pull requests merged and pull request merge duration. Let’s analyze each of them with the new GrimoireLab panels:
Pull request merge duration

This panel focuses on pull request merge duration, defined by the time between a code merge request and code commit. In this case, we focus on GitHub pull requests.
When we measure GitHub, we cannot identify if a pull request has been merged, only if this is open or closed. That’s the reason why we will base our panel on pull request closing time. However, if we would like to measure GitLab, as there is a “merged” state, we will be able to identify a proper “merge request”
So, how can these metrics help us identify a project state? If we analyze the panel with other community metrics we can find some interesting insights:
If we observe a project in an early stage, we can find a situation where there are a lot of organizations and newcomers participating within it, and time to close measured by days is quite fast
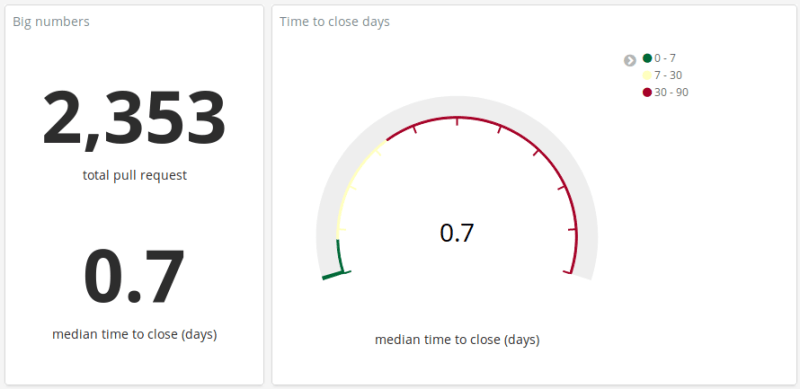
On the other hand, a decline project normally implies low participation level among organizations and long periods of time to close pull requests
You can also find answers for these type of questions:
- What is the duration of time between code merge request and code commit?
- Is my project taking too long when closing code merge requests?
- What organizations/authors are being more efficient when closing a pull request?
Lines of code changed

The idea behind the panel is having a look on how community contributes to the repositories by having a look at the magnitude of those changes with several metrics related with Git commits, specially modified lines and the amount of affected files. By using this panel we can identify and analyze behaviors of specific organizations, projects or repositories.
If at this panel we observe a given project in an early stage, we expect to observe a higher number of modified lines (presumably, more added lines than removed) in a narrower time-range. That would correspond with high peaks in the evolution of lines added vs lines removed chart.
If that project has became stable, the expected number of modified lines will be smaller than before, but keeping in mind the value wouldn’t vary drastically except for events such code refactoring or major updates.
If we are looking at a project in close to its final days, we expect the number of modified lines would decrease significantly, and we would not observe high peaks even considering wider time-ranges.
Pull Requests merged

The main goal is get an overall idea of how community performs and evolved merging Pull Requests. By using this panel we can identify trends and analyze behaviors of specific organizations, projects or repositories.
A growth or maturity project tends to show more activity (both open and close PR), which means a bigger amount of pull requests will be closed and merged. However, if the project is at a decline stage, both the amount of open and closed pull requests will be at very low rates
Work in progress!
GrimoireLab is member of the CHAOSS Linux Foundation project (Community Health Analytics Open Source Project) focused on creating analytics and metrics to help define community health. If you’re interesting in software community metrics, we encourage you to get to know the CHAOSS community and learn how to participate.


